
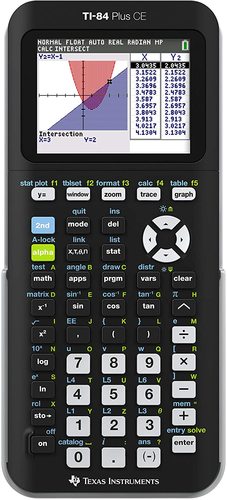


Visualize concepts clearly and make faster, stronger connections between equations, data and graphs in full color.
- Enhanced screen readability with high-resolution, backlit display
- Distinguish between multiple graphs and plots with color-coded equations, plots and objects
- Make graphs easier to read by adding grid lines
Approved for exams
The TI-84 Plus CE is approved for use on the following exams:
- PSAT®, SAT®, and ACT® college entrance exams
- AP® exams that allow or require a graphing calculator
- Approved for use on the IB® Diploma Programme exam
Applications
- Cabri™ Jr.
- CellSheet™
- Conics
- Inequality Graphing
- Language Localizers
- Periodic Table
- Polynomial Root Finder/Simultaneous Equation Solver
- Probability Simulation
- Science Tools
- Transformation Graphing
- Vernier EasyData®
Built-in functionality
- Add images to graph background
- Fifteen colors for function graphing
- Change style and color of axes and grids on graphs
- Catalog syntax help
- Alphabetical CATALOG of all TI calculator operations in one menu
- Advanced functions accessed through pull-down display menus
- Real and complex numbers calculated to 14-digit accuracy and displayed with 10 digits plus a two-digit exponent
- Graphs 10 rectangular functions, six parametric expressions, six polar expressions and three recursively-defined sequences
- Up to 10 graphing functions defined, saved, graphed and analyzed at one time
- Sequence graphing mode shows time series plot, cobweb/stair-step plot and phase plots
- User-defined list names: Lists store up to 999 elements
- Seventeen interactive zoom features
- Numeric evaluations given in table format for all graphing modes
- Interactive analysis of function values, roots, maximums, minimums, integrals and derivatives
- Eight different graph styles for differentiating the look of each graph drawn
- Horizontal and vertical split-screen options
- View graph and table side-by-side
- Stores up to 10 20x20 matrices
- Matrix operations including inverse, determinant, transpose, augment, reduced row echelon form and elementary row operations; convert matrices to lists and vice-versa
- List-based, one- and two-variable statistical analysis, including logistic, sinusoidal, median-median, linear, logarithmic, exponential, power, quadratic polynomial, cubic polynomial, and quartic polynomial regression models
- Three statistical plot definitions for scatter plots, xy-line plots, histograms, regular and modified box-and-whisker plots, and normal probability plots
- Advanced statistics features including 10 hypothesis testing functions, seven confidence interval functions and one-way analysis of variance
- Fifteen probability distribution functions including Normal, Student-t, Chi-square, Binomial and Poisson
- Business functions including Time-Value-of-Money (TVM), cash flows and amortization; full screen interactive editor for solving TVM problems
- Interactive equation solver editor allows solving numerically for different variables in an equation
- Eleven regression calculations